Each tool has its own purpose and we consider them now, starting with the top.
Note
Keep
in mind that many other tools exist beyond what we have in our Toolbox.
Troubleshooting is not an easy task at times, and we need to reach for
a different set of tools, such as Eseutil.exe, which is used for
offline defragmentation and analysis of the database’s integrity. Other
tools can be located on Microsoft’s website and can be used to perform
everything from benchmarking (Load Generator, Exchange Stress and
Performance 2007, and Exchange Server Jetstress) to gathering
information (Exchange Profile Analyzer and Information Store Viewer)
and more. The point is that you should investigate more tools if you
plan to be a solid Exchange Administrator.
The Best Practices Analyzer
Considered
a management tool, the Exchange Best Practices Analyzer (ExBPA)
performs monitoring and troubleshooting by ensuring best practices are
being followed between your Exchange servers and the AD environment.
With
the ExBPA, you can perform a baseline of your system to report
differences it sees from that baseline and future scans. You can also
perform a health check, a health/performance check, a permission check,
a connectivity check, and the readiness check.
To run the tool, perform the following:
1. | Open the EMC.
|
2. | From the Navigation Tree, select Toolbox.
|
3. | At the top, under Configuration Management Tools, select Best Practices Analyzer, and click Open Tool from the Actions pane.
|
4. | The tool checks for updates, and then you can click the link Go to the Welcome Screen.
|
5. | You
can begin a new scan or look at a preexisting scan you performed at an
earlier time. In this case, click Select Options for a New Scan.
|
6. | You
are asked to provide the name of the AD server (usually this is filled
in for you), and you can show advanced login options if you need to
change your credentials to access the AD server. Then click Connect to
the Active Directory server.
|
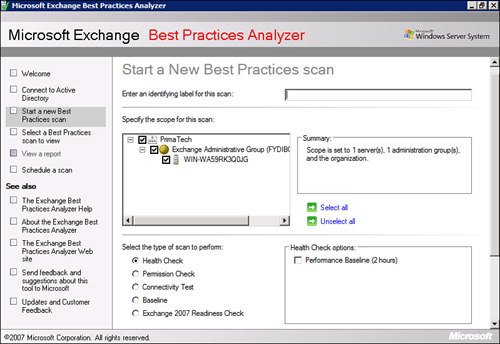
7. | As you can see from Figure 1,
you need to provide a name for the scan, select a scope (an entire
organization or individual servers), and then choose the type of scan
to perform. Keep in mind that if you choose a baseline, it could take
up to two hours. Then choose the speed of the network and click Start
Scanning, or you can schedule a scan to occur at a better time.
|
8. | After the scan has completed, you can choose the link View a Report of This Best Practices Scan.
|
9. | You
are shown a report that provides critical or informational issues that
are affecting the health and performance of your Exchange organization.
Suggestions are also made to correct the problems that are found.
|
10. | When you see a problem, select it and you are shown options to learn more about the problem and how to resolve it.
|
11. | When complete, close the analyzer.
|
Disaster Recovery Tools
Within the Toolbox, we have two disaster recovery tools.
Database Recovery Management
When
a disaster strikes with your database (or disks), the Database Recovery
Management tool can help you to bring your system back online.
To run the Database Recovery Management tool, perform the following:
1. | Open the EMC.
|
2. | From the Navigation Tree, select Toolbox.
|
3. | Under Disaster Recovery Tools, select Database Recovery Management and click Open Tool from the Actions pane.
|
4. | Select Go to Welcome Screen.
|
5. | You
are asked for server and user information. Provide a label. Make sure
you have both an Exchange server and domain controller name in the
required fields. If there is a need to alter your logon options, you
can select Advanced Logon Options and then click Next.
|
6. | You are asked to select one of the following tasks:
Obviously, there are many different ways to go with this tool.
|
Database Troubleshooter
This
tool is not quite as powerful as the Recovery Management tool. You use
this tool in situations where the database won’t mount or there are
inconsistencies in the log file—perhaps you have run out of disk space
or the log files have run out of numbers for the log file naming (which
is unlikely, but it can happen).
Note
The
procedure for running the Database Troubleshooter tool is
straightforward; you simply provide the number of minutes of database
events that you want to detect (0 indicates all). The default is set to
120.
Mail Flow Tools
When
you have a problem with your Exchange server that isn’t a database
issue or a physical problem with a server, oftentimes it is a mail flow
issue. Mail isn’t flowing properly, mail is getting stuck somewhere,
mail isn’t leaving your organization to go to the outside—these issues
can cause frustration on the part of your users.
Several tools within the Toolbox can assist in this regard. Let’s examine them one at a time.
Mail Flow Troubleshooter
When
using the Mail Flow Troubleshooter, you can indicate the symptom that
you are trying to track down. The symptoms include the following:
- Users receive unexpected nondelivery reports when sending messages.
- Expected messages from senders are delayed or are not received by some recipients.
- Messages destined to recipients are delayed or are not received by some recipients.
- Messages are backing up in one or more queues on a server.
- Messages sent by user(s) are pending submission on their mailbox server(s) (for Exchange Server 2007 only).
- Problems with Edge Server synchronization with Active Directory (for Exchange Server 2007 only).
Message Tracking
This
is not a new tool in Exchange, but it is one that has evolved over time
and we appreciate its purpose. Message tracking is enabled by default
on the Hub and Edge Transport servers and the Mailbox servers.
You
can use the Exchange Management Shell (EMS) to search message-tracking
logs; however, the EMC offers a search tool with a simple interface to
work with. If you wish to use the EMC to search the message tracking
log, perform the following:
1. | Open the EMC.
|
2. | From the Navigation Tree, select Toolbox.
|
3. | Under Mail Flow Tools, select Message Tracking, and from the Actions pane, click Open Tool.
|
4. | On the Message Tracking Parameters page shown in Figure 2, you can select checkboxes to include criteria in the message-tracking search. You can configure the following:
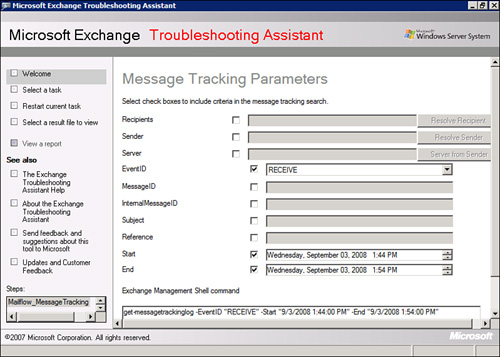
- Recipients
- Ender
- Server
- EventID (by default is set to RECEIVE)
- MessageID
- InternalMessageID
- Subject
- Reference
- Start
- End
|
5. | Make your configuration choices and then click Next.
|
PS Note
You
can see the Exchange Management Shell command listed at the bottom of
the Message Tracking Parameters with the options you have provided.
It’s
impossible to say what you will look for at any given time, so these
options change depending on your needs. Notice the extreme flexibility
in this tool. Here you have the EventID, where, if you select the down
arrow, you can see several options such as RECEIVE (which is used to
look for messages received by the server), DELIVER (used to search for
messages delivered to a mailbox), or SUBMIT (used by Mailbox servers
that submit items to the Hub Transport servers).
Queue Viewer
The
Queue Viewer is a tool that shows SMTP messages that have not completed
their journey. These might be inbound or outbound messages, and they
can be delayed for any number of reasons.
From
within the Queue Viewer, you can choose the server you wish to connect
to (the default is the local server). You are shown three different
views of the queues: all queues on the server, all messages in all
queues on the server, and all messages filtered for a specific queue.
You
might be able to determine whether messages are sitting in the queue
because DNS is failing, Hub Transport servers are not available, or
perhaps the destination server is unavailable. Another feature is the
capability to remove with NDR and remove without sending NDR, which is
great for spam that is coming into your server.
Note
If
the Queue Viewer doesn’t start because the Transport Service isn’t
starting, you might have an IPv6 issue. Before you try to start the
service, go to your network properties, and even if IPv6 is enabled,
provide a static IP address for the connection. Then start the
Transport Service and you will have no trouble starting Queue Viewer.
Routing Log Viewer
The
Routing Log Viewer is a new tool in Exchange 2007 SP1. It is designed
to work on the Hub Transport and Edge Transport servers. This tool can
help analyze the routing topology and determine whether the way mail
moves is the best method for the site topology.
When you open the tool, it is a blank box. To open log files, perform the following:
1. | From within the Routing Log Viewer, select File, and then select Open Log File.
|
2. | You
can type the name of the transport server, browse server files, or
browse local files, depending on where you are running the tool. If you
are on the Hub or Edge Transport server already, just click Browse
Local Files. Then select a document you wish to analyze and click Open.
|
3. | Here you can see the following tabs:
- Active
Directory Sites and Routing Groups—Shows your sites and routing groups.
You can see if a site whether a hub site (and if it is, the next hop
site will be indicated, too). You can see the total cost to deliver
mail to the site. The Backoff path is shown, too (in the event there is
a problem delivering a message).
- Servers—Lists all the
servers within your Exchange organization. You can see the proximity
from the local server to those other servers, so you are able to see a
map between the servers. You can see server roles for each server, and
the total cost to send messages from the local server to other servers.
- Send
Connectors—Shows a list of all SMTP connectors for your Exchange
organization (including foreign connectors and routing group
connectors).
- Address Spaces—Shows address spaces within the organization. Each space has a cost-associated connector that is ordered.
|
4. | If
you note any configuration changes that must be made, such as if you
determine that messages are not routing according to the lowest cost
path, consider reviewing your topology and making some changes.
|
5. | When you are finished analyzing, you can close the tool.
|
One
of the more interesting features of the Routing Log Viewer tool is that
you can load different routing table logs and see the differences
between them. If there are changes between them, they are highlighted
and you can see the modification quickly.